
IC50 is a deep rabbit hole
On harmonizing data, because ground truth in biology is unlike text

Data harmonization is often an afterthought in the brave new world of large ML models. Just feed the AI everything, and let the model figure it out. Right?
Real ground truth doesn’t exist in biology
This approach worked beautifully for language, but there’s a reason why biology is an entirely different beast.
In language, text is its own ground truth. Every sentence is a sequence of characters. All meaning there is emerges entirely from that sequence. An A is an A no matter the font. All letters of the same kind are completely interchangeable, so the alphabet is a complete catalog, and the text is a complete description.
But a cell is not just a cell.
Every cell has state. In theory, every single living cell traces its lineage back to LUCA - the last universal common ancestor - but each one has a slightly different history. Therefore no two cells are really identical. Some of those differences in the cell state probably don’t matter for predicting response, but others certainly do. The problem is we don’t yet know which is which. If we could measure everything that matters, we can have a complete description similar to text. That’s not the case for the time being.
We don’t yet have any way to completely describe a cell with numbers.
So any experimental readout - whether it’s viability, protein assays, sequencing, or omics data - is just a snapshot of a yet invisible generating process. That’s ultimately what we’d like to understand - a gargantuan hidden Markov model with bajillions of states.
A quick detour on hidden Markov models
…Yes? You don’t know what hidden Markov models are? Oh.
If you grew up after deep learning happened, you might have missed hidden Markov models (HMMs).
The idea is that there is an internal “generating state” which you cannot directly observe (X₁, X₂, X₃), but you know that each state has slightly different probabilities (b₁₁, b₁₂, etc.) of producing visible outputs (y₁, y₂, …).

The goal is to learn these probabilities and infer the generating state from the input sequence. A classic example was predicting whether and unknown DNA segment is part of a gene. Coding regions tend to have higher GC content than non-coding regions, which the HMMs could recognize.
So, where were we?
You can be training the wrong idea
Since we don’t have a complete cell descriptor, the context in which your data was generated matters a lot. Metadata is key.
Otherwise you will confuse the AI.
Say you’re training a model using both gene knockout (KO) and drug response data. There’s a discrepancy: a pair of data points where a drug kills the cell but knocking out its target doesn’t.
Why? A drug may bind to other proteins we don’t know about. If your system just assumes that KO = drug (in high enough dose), you just taught the model that the drug kills the cell at low doses, and brings them back to life as the dose tends to infinity.
I’ve been surprised how often these curation issues get overlooked, especially by teams coming primarily from the ML world. But biology is messy. We’ve worked with big-name ML groups relatively new to biopharma and much of what follows came as a surprise to them. So let me show you just the tip of the iceberg.
Nothing fancy, no RNA-seq, Perturb-seq, no CRISPR, no complex combinations. Not even multiple modalities. Just plain old drug response data.
Curating an “IC50” data point
Let’s say you have this data point:
Dabrafenib, HeLa, 50% inhibition @ 10 nM.
What should you tell the AI? What is missing from here?
Let’s check the underlying data. You have that, right?
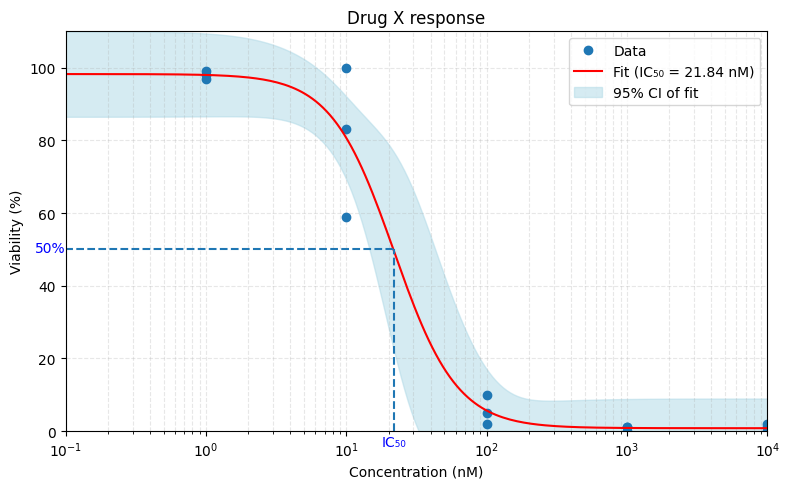
This is how it might look like. We take the data points, fit a sigmoid curve on it, and take the halfway point on the y-axis, right? Simple.
But wait:
1. What do you mean by inhibition?
Remember, cells keep growing during an assay. So did you measure:
the point where the cells grow half as fast as without the drug?
the point where you have half as many cells as you started with?
the point where you have exactly half as many cells as a control growing in a different well?
All of these have, at some point, been labeled “IC50”. That’s incorrect.
The first one is called GI50 (for Growth Inhibition).
The second is LD50 (for Lethal Dose).
And only the third is truly IC50.
So unless you compare to a control, your value is not IC50, no matter how it’s called.

2. What do you mean by “50%”?
But what if your dose-response curve never hits 0?
Most drugs don’t kill all cells. So we must also distinguish between absolute 50% inhibition, and 50% of the maximum observed inhibition. Only the first one is IC50. The second is formally EC50, but of course these terms are used interchangeably all the time. It doesn’t help that they coincide on example curves where the dose-response curve does hit 0.

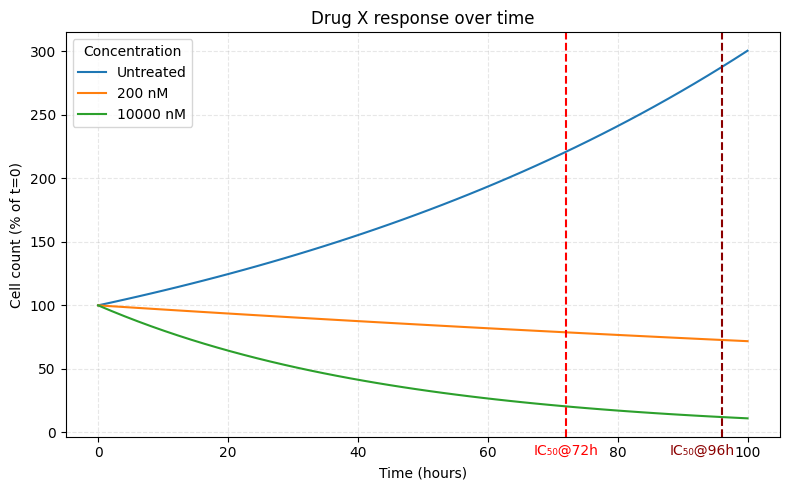
3. How long was the treatment?
Some drugs act on different timescales. For instance DNA damage response (DDR) inhibitors generally do nothing in the standard 3-4 day assays. You need 7 days before enough DNA damage accumulates to visibly affect cell behavior.
But there’s also a mathematical problem.
Cells grow exponentially. At the same time, the 50% is a linear ratio of the untreated and treated cell counts. What you’re really modulating is the rate of growth (and cell death). So even if the drug effect is constant, a 3 and a 4 day measurement will yield different IC50 values.
Fortunately, you can correct for this mathematically, but only if you know how long the experiment lasted.
4. How did you fit the curve?
If your data is well behaved, most curve-fitting methods will give you similar IC50 values.
But what if your data looks like this?


So what should you do? Just say there’s no prediction? In many use-cases you need to give a value no matter what. Depends on your use-case, but make sure you use the right data. For example, GDSC’s non-linear mixed effects(NLME) fitting does the latter - uses other cell lines’ data to give you a prediction no matter how ugly. We prefer just saying no if we can, so we had to refit all the curves with a different algorithm. But we needed to be aware to do that and needed to get the individual dose point data.
5. What did you actually measure?
How do you tell which cells are dead? Unless they completely dissolve (which they don’t in typical assay timescales) there’s no large “DEAD” sign written on a dead cell. You need some way to tell them apart.
And that’s the next issue. Some assays (like CellTiter-Glo) measure ATP levels to estimate live cell count. Others measure their metabolic rate by tracking NADH use (resazurin - Alamar Blue). You can also use DNA intercalators to highlight individual dead cells undergoing apoptosis, and count them under a microscope.
But these methods don’t agree perfectly. Not all cells die via apoptosis. Some cells may have metabolism but are already doomed. Some drugs just mess with the assay readout directly (see below).
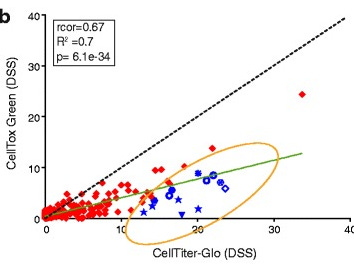
Do you have the metadata to tell them apart?
The data’s in the details
I’m leaving out plenty of advanced topics like seeding density or the physical location of the well on the plate - you get the idea.
Until we have an “ultimate data type” that fully captures cell state, understanding and harmonizing the data is not optional - it’s paramount.
Thanks to Balazs Szabo and Miklos Laczik for their help with the NLME fitting and Richard Izrael for the ideas and reviewing!